Normal Distributions
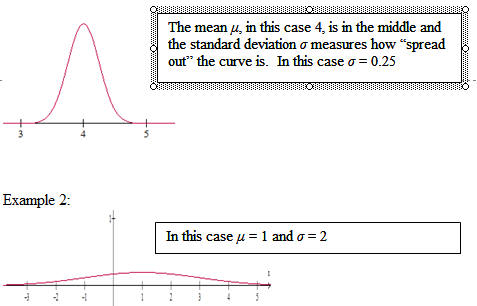
A normal distribution is represented by a symmetric bell-shaped curve. The curves extend for ever in both directions. As you can see from the graphs a fair distance from the middle there is essentially nothing you can measure. In all cases the total area under the curve is 1.
Example 1:

Note: We use X to represent a value in a normal distribution. In a normal distribution the probability that X is equal to a particular value is 0. In symbols
P(X = k) = 0. We consider probabilities that X lies in a range of values. The probabilities are equal to areas under the curve.
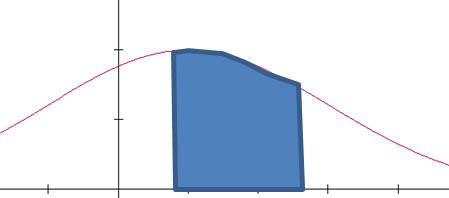
The probability that X lies between a and b, in symbols P(a < X < b) is the shaded area.

a b
The probability that X is less than a, in symbols P( X < a) is the shaded area:

a
The probability that X is greater than a, in symbols P( X > a) is the shaded area:

a
In order to calculate probabilities we use the standard normal distribution, which has mean = 0 and standard deviation = 1. We use z for the variable, which
represents z-score as introduced earlier:
![]()
This is a graph of the standard normal distribution. You
do not need to know it, but the function is
![]()
Example 3: A normal distribution has mean 10 and standard deviation 2. Fine the probability that a randomly selected value lies between 7 and 11. That is,
P(7 < X < 11) . You convert 7 and 11 to z-scores
Then P(7 < X < 11) = P( ̶ 1.5 < z < 0.5)
On a TI83+ this is calculated as normalcdf ( ̶ 1.5, 0.5) = 0.6247.
Example 4: A normal distribution has mean 10 and standard deviation 2. Fine the probability that a randomly selected value is less than 6. That is,
P( X < 6) . You convert 6 to a z-score
Then P(X < 6) = P (z < ̶ 2)
On a TI83+ this is calculated as normalcdf ( ̶ 10000, ̶ 2) = 0.0228. (you can use any large negative number in place of ̶ 10000)
Example 5: A normal distribution has mean 10 and standard deviation 2. Fine the probability that a randomly selected value is greater than 11.5. That is,
P( X >11.5) . You convert 11.5 to a z-score
Then P(X > 11.5) = P (z > 0.75)
On a TI83+ this is calculated as normalcdf ( 0.75, 10000) = 0.2266. (you can use any large positive number in place of 10000)