Confidence Intervals for Proportions
Suppose you survey 200 people and 48 say they smoke. Then the proportion in the sample of 200 people who smoke is 48/200 = 0.24.
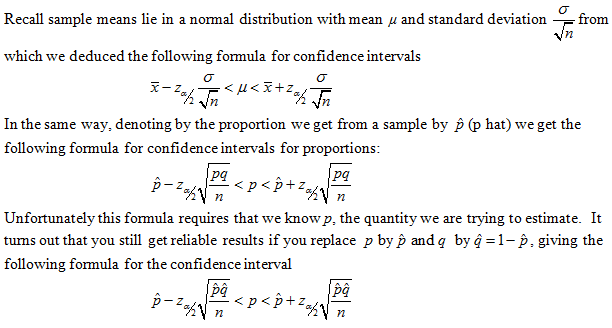
This gives us a point estimate of the true proportion of people who smoke. The idea is to construct an interval for which there is, say, a 95% chance
that the interval contains the true population proportion. This would be the 95% confidence interval for the proportion.
Note: We use p for the true population proportion and q for 1 - p.

Note: This is valid for large values of n. The usual criteria is np > 5 and nq > 5, a condition that is easily satisfied in the examples we study.


You can either evaluate it on a calculator or get it from the last line of the t-table.
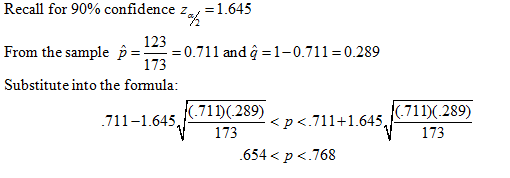
Example 1: You survey 173 students and 123 say they drive to campus daily. Find the 90% confidence interval for the
proportion of students who drive to campus daily.

There is a 90% chance that between 65.4% and 76.8% of students drive to campus daily.
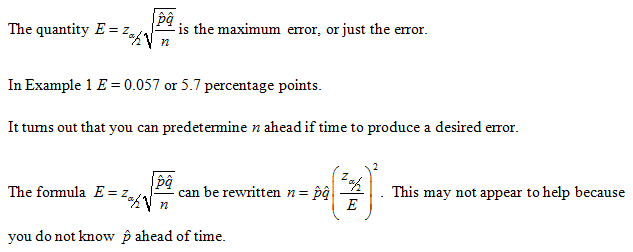
Note that you get a fairly wide range for the confidence interval. It turns out that to get a narrow range you need large samples.
Sample size


Example 2. Suppose you wish to know with 99% confidence the proportion of voters who will vote for candidate Jones in an upcoming election
with an error of no more than 2 percentage points. That is, E = 0.02.
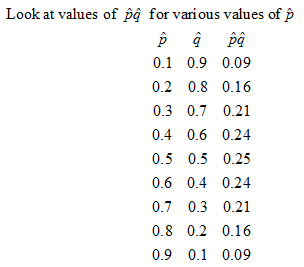
(a) Determine the sample size needed supposing you have no idea what proportion will vote for Jones.

In order to sure n is big enough always round up. Survey 4,148 voters.
(b) Determine the sample size needed supposing an earlier polled showed 60% will vote for Jones.

Question: Why would you want to limit the sample size?
Answer: Gathering data is expensive!