Measures of Variation B
Chebyshev's Rule
It turns out to be useful to measure how far a data value is from the mean in terms of standard deviations for example we say

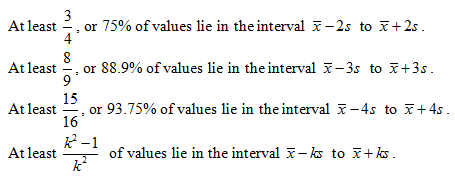
Chebyshev's rule states the following:

For example, a sample of 80 values has mean = 50 and standard deviation = 10. Then at least 60 (= 75% of 80) of the values will lie in the interval 50 - 2(10) to 50 + 2(10), or 30 to 70.
Example: A sample has mean 32 and standard deviation 3. At least what percent of values are guaranteed to lie in the interval 23 to 41?
Answer: In order to be successful in this type of problem you will first need to recognize it is a Chebyshev's rule problem. Having done that you need to see that 23 to 41 is x - 3s to x + 3s
so 88.9% of values lie in the interval 23 to 41.
The Empirical Rule
In nature many distributions turn out to be symmetric and bell-shaped like so

If you have a bell-shaped distribution then the empirical rule applies. It states (Note the approximately as compared to at least in Chebyshev's rule!)
Approximately 68% of values lie in the interval x - s to x + s
Approximately 95% of values lie in the interval x - 2s to x + 2s
Approximately 99.7% of values lie in the interval x - 3s to x + 3s
For example: Batteries have a life that is bell-shaped with a mean life of 72 hours with a standard deviation of 14 hours. What percent of batteries would you expect to last more than 86 hours?
Answer: You first have to recognize that 86 is x + s. You then have a picture

Since the distribution is symmetric the mean is in the middle. There are 68% of values between 58 and 86. There are 32% of values remaining, half of which must be more than 86 and half of which must be less than 58.
You conclude about 16% of batteries will last more than 86 hours.
The Rule of Thumb
The rule of thumb is intended to give you a rough idea what the standard deviation should be. You most likely will not find it a very convincing rule!

The Coefficient of Variation
Suppose you have two sets of data and you wish to determine which is more variable. The actual size of the variation can depend on how the data is measured. The coefficient of variation can be used to compare two standard deviations. It is defined to be


Using the coefficient of variation, which sample is more variable?
You calculate :

You conclude Sample 1 is more variable.