Measures of Variation
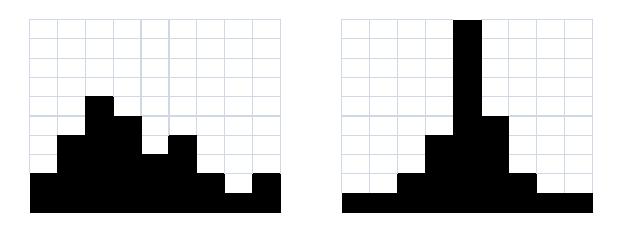
The idea is to measure how widely scattered is a set of data. Consider the two histograms below

The Range
The range is the highest value minus the lowest value. For example for 4, 6, -5, 4, 1, 2 the range is 6 - (-5) = 11. Knowing the range can be helpful, but it is not that useful.
Compare the two histograms above, they each have the same width, so the ranges are the same, and the same number of squares are shaded in each so they contain the same amount of data. The one on the left appears more spread out or more variable. The standard deviation described below turns out to be the most useful way to measure variation.
Variance and Standard Deviation

In practice we do not use this formula to compute the variance. It is intended to help you understand the concept. If data is widely scattered the difference between data values and the mean will be large making the variance large. If data is close together the difference between data values and the mean will be small making the variance small.

A better way to compute the variance is using an equivalent formula, which on the surface seems more complicated, but it avoids having to use the mean, which is helpful when the mean is a complicated decimal.


Note a statistic is a measure you get from a sample, such as the variance. A parameter is the corresponding measure for the population. In statistics we use statistics gathered from data to estimate parameters.
Why divide by n - 1 rather than n when computing variances for samples?
The standard deviation is the square root of the variance, denoted s for samples and σ for populations.
